The High Cost of Low Visibility: How Real-Time Dashboards Improve Frontline Decision-Making
The High Cost of Low Visibility: How Real-Time Dashboards Improve Frontline Decision-Making
In today’s fast-moving operational environments, one of the biggest barriers to safety and efficiency isn’t a lack of data—it’s the inability to access it when it matters most.
Frontline supervisors, operations managers, and safety leaders routinely make high-impact decisions with incomplete information. Fragmented spreadsheets, disconnected point solutions, and slow reporting cycles create blind spots that directly affect performance, risk, and compliance outcomes.
Real-time dashboards are changing that dynamic. By unifying incident data, observations, audits, corrective actions, and operational metrics into a single, always-current view, organizations can move from reactive firefighting to proactive decision-making.
Why Visibility Matters More Than Ever
Operational teams today face unprecedented pressure: rising production demands, evolving regulations, workforce turnover, and increasingly complex hazards. Decisions once made weekly or monthly now need to happen instantly—and with greater accuracy.
When teams lack up-to-date visibility, common consequences follow:
- Delayed incident response due to slow information flow
- Increased risk exposure from missed leading indicators
- Inefficient resource allocation because no one sees the full operational picture
- Compliance gaps that arise when data lives in multiple systems
- Poor communication between safety, operations, and leadership teams
The cost of low visibility is not just financial—it often shows up in safety culture, operational disruptions, and preventable incidents.
What Real-Time Dashboards Enable
Modern QHSE dashboards provide more than charts—they deliver an operational pulse check.
1. Instant Insight Into Emerging Trends
Near-real-time updates allow supervisors and managers to spot leading indicators early:
- Increasing near misses in one line or shift
- Recurring audit findings in a specific department
- Rising contractor incidents
- PPE compliance drops during certain time windows
Identifying patterns early means organizations can intervene before minor issues escalate into major events.
2. Clear Prioritization Across Teams
Dashboards highlight what needs attention right now:
- Overdue corrective actions
- High-severity incidents requiring supervisory review
- Open investigations nearing deadlines
- High-risk permits or activities in progress
This provides clarity and reduces the decision fatigue that comes with managing multiple channels of disconnected information.
3. Alignment Between Safety and Operations
Frequently, safety and operations view performance differently.
Dashboards create a shared source of truth—helping teams collaborate with real, current data instead of assumptions or outdated reports.
4. Mobile-Ready, Frontline-Driven Action
When dashboards extend to tablets or smartphones:
- Supervisors can make decisions on the floor
- Technicians can see key alerts before starting work
- Leaders get real-time visibility during critical events
This closes the loop between reporting, analysis, and action.
The Shift From Lagging to Leading Indicators
Historically, organizations relied heavily on lagging indicators—incident rates, severity totals, annual audit findings. These remain important, but they reveal past issues rather than future risks.
Real-time dashboards center the data that predicts incidents:
- Near misses and unsafe conditions
- Behavioral observations
- In-progress work permits
- Corrective action cycle times
- Training and competency status
- Environmental exceedances
By making these visible, organizations transform QHSE management from reactive to anticipatory.
How to Implement Effective Operational Dashboards
The most impactful dashboards share several characteristics:
1. Integrated Data Sources
Connecting incidents, audits, environmental data, risk assessments, and corrective actions ensures context and depth.
2. Role-Based Views
Supervisors, plant managers, safety leaders, and executives each need tailored insight—not the same dashboard.
3. Automated Updates
Manual consolidation leads to errors and stale data. Automated data flows ensure reliability and speed.
4. Actionable KPIs
A dashboard should answer daily operational questions, such as:
- “What requires immediate attention?”
- “Are we seeing an increase in unsafe behaviors?”
- “Where are our highest operational risks today?”
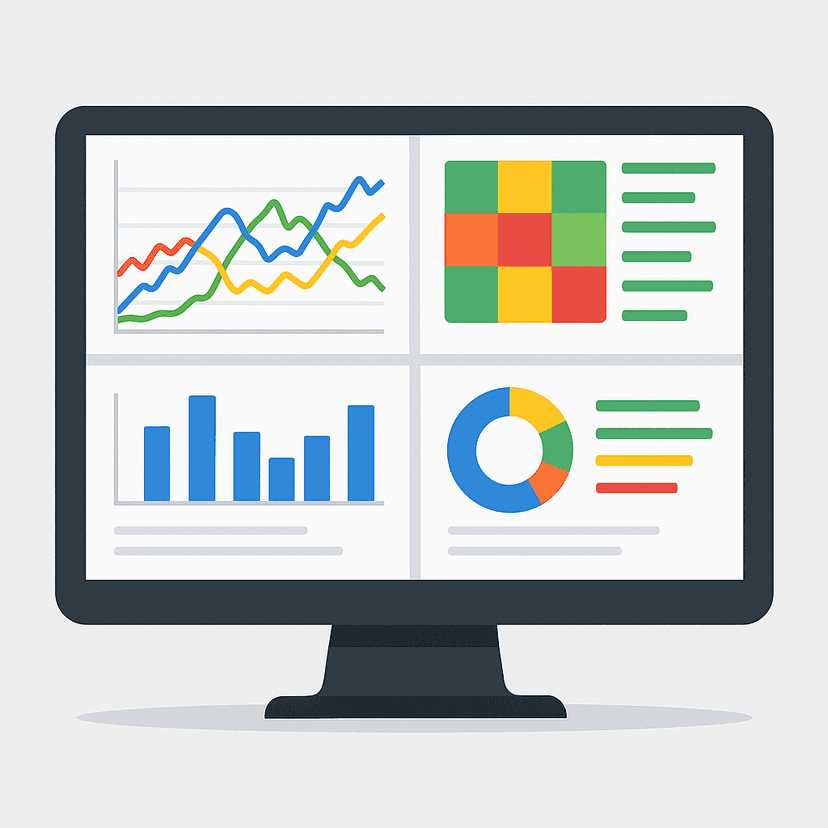
5. Visual Storytelling
Heat maps, trend lines, and risk matrices communicate insights faster than static spreadsheets ever could.
Building a Culture of Data-Driven Decision Making
Real-time dashboards do more than improve visibility—they fundamentally shift how organizations operate. When every level of the business has timely, accurate information:
- Leaders focus on strategy instead of chasing status updates
- Managers allocate resources efficiently
- Supervisors act on insights rather than intuition
- Frontline workers feel supported with clear expectations
This level of alignment strengthens safety culture, increases productivity, and reduces operational surprises.
Conclusion
In an era where operational speed and risk complexity continue to increase, real-time dashboards are no longer optional—they are essential. By replacing fragmented data with unified, live insights, organizations can elevate safety, reduce risk, and empower teams to make smarter decisions every day.
Ready to revolutionize your safety management? Discover how our QEHS SaaS platform can help your organization lead in the digital age of occupational health and safety.
Request a Demo or Contact Us to learn more.